
Computer Management
Monitor Computer Resources and Workloads
By TermSquad · Last reviewed
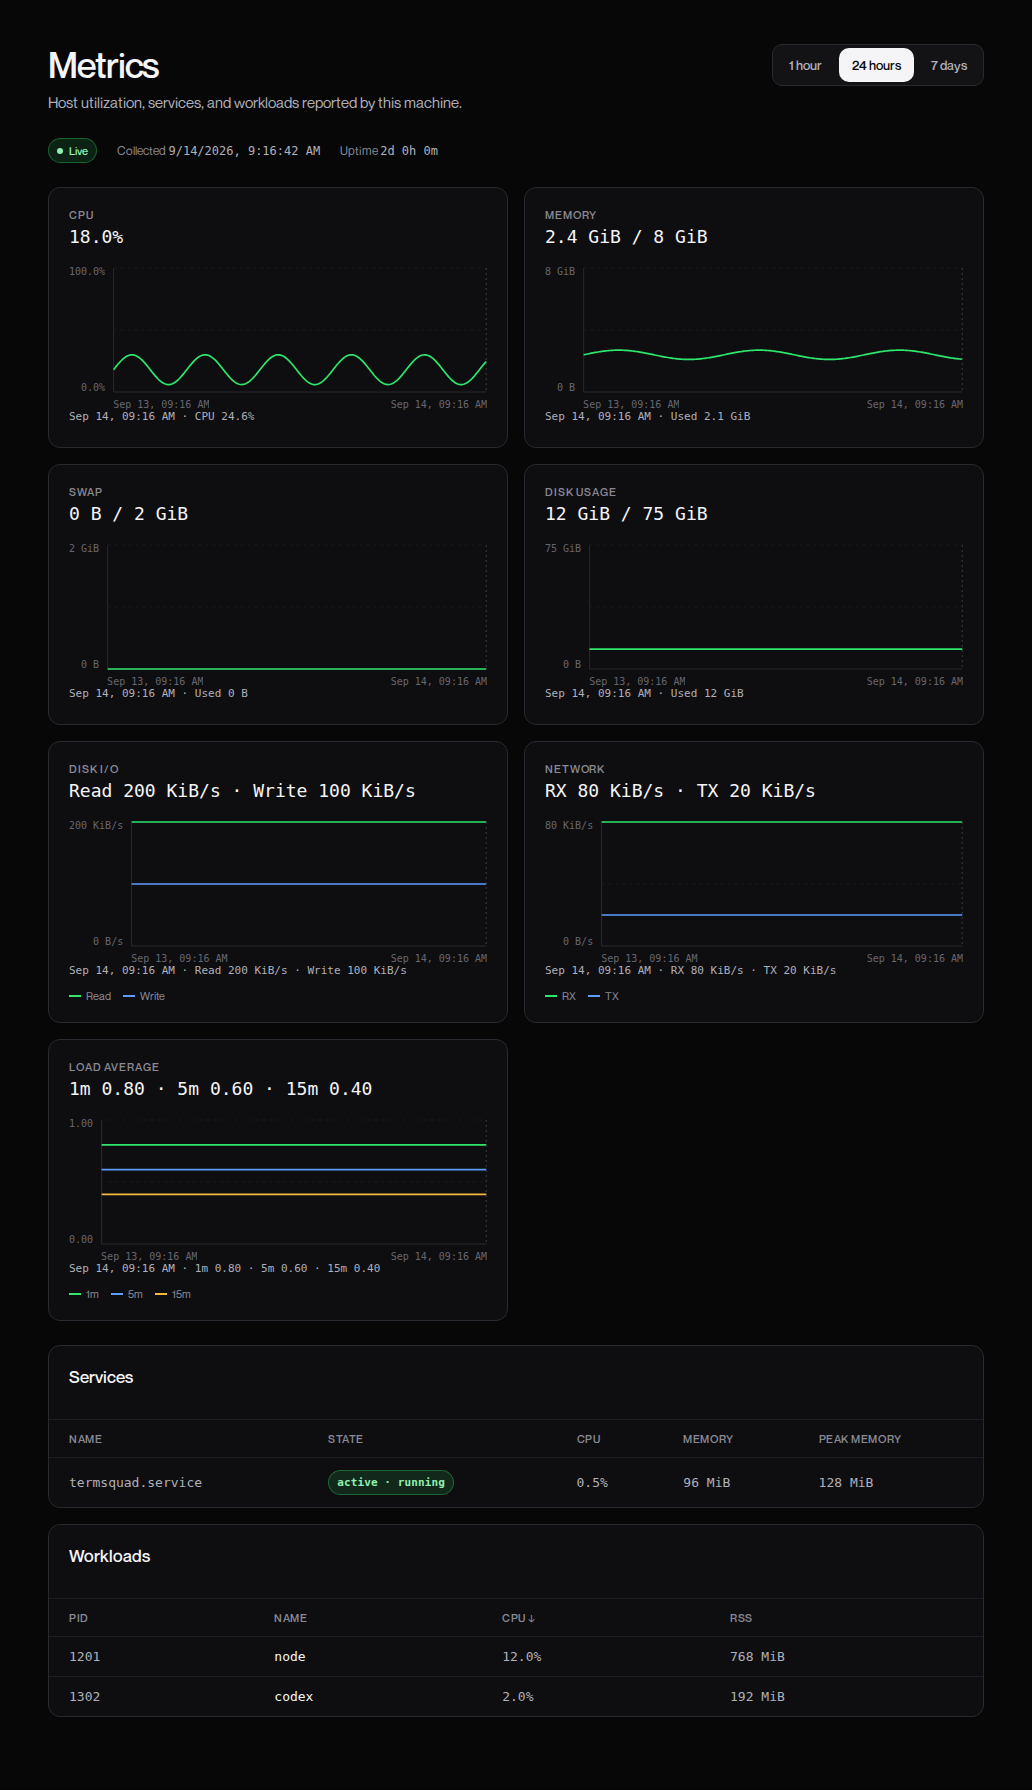
Open Metrics to inspect resource usage on the selected computer. Start by checking the collection time and whether the page says Live or Historical data.
Read the charts
Choose 1 hour, 24 hours, or 7 days to change the history range.
| Metric | What it helps explain |
|---|---|
| CPU | Processing load from builds and other work. |
| Memory and swap | RAM pressure and use of disk-backed overflow, when configured. |
| Disk usage | How much storage remains. |
| Disk I/O | Read and write activity. |
| Network | Received and transmitted traffic. |
| Load average | Work waiting for or using system resources over time. |
A brief spike during a build can be normal. Sustained pressure alongside slow responses is more useful evidence than a single peak.
Find resource-heavy work
Scroll to Services for service state, CPU, memory, and peak memory. Scroll to Workloads for processes and their IDs.
Use the CPU or RSS column control to sort workloads. RSS is the process’s resident memory usage. A process ID helps identify the specific workload in the terminal.
The page is for observation; it does not provide a general kill-process button.
Check freshness
Metrics refresh about every 60 seconds while the page is visible. A stopped computer or a snapshot more than three minutes old is shown as historical. Unavailable means a value was not reported, not zero usage.
See slow or full computers and TermSquad Guard.